Last fall we asked all members to complete a short survey. We had 177 responses, a little under a 50% response rate. Some of the highlights have already been presented in two Newsletter articles. Frequency distributions for all questions have been posted on the website as a pdf file.
A few interesting items include:
Almost a quarter of all respondents were new to the Club last year. (From registration data, about 30% of members were new.) Despite restrictions on rides and many people hunkering down due to COVID, many people want to get out and about outdoors. (It was difficult to find bikes and cross-country skis in the shops last year.)
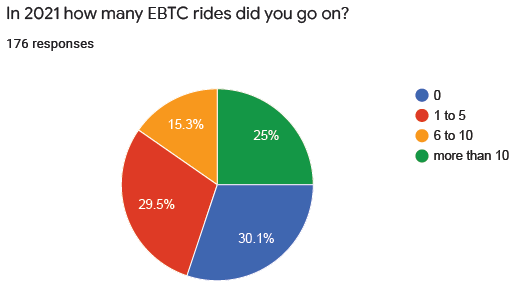
Thirty percent of respondents did not go on any Club rides last year. Some were undoubtedly very COVID-cautious. A few reported health issues but hoped to be back in the saddle this year. Despite all the disruptions, a quarter of respondent went on more than 10 Club rides last year.
Ride preferences
Road ride are the most popular (68% of respondents would Often go on Road rides) but almost two thirds would go on Trail rides at least Sometimes and 35% would go on Winter rides at least Sometimes. 2021/22 is the first year that we have had winter rides.
Social/recreational rides are clearly the most popular, including with breaks, although three quarters of respondents would go on Training rides at least Sometimes.
Road rides of 40 to 60 km are most popular though over 80% said that they would go on rides of 60 to 100 km at least Sometimes. While less than 1/3 of all respondents would Often go on rides under 40 km, almost ¾ of new members would often go on short rides.
Communication, registering and navigating
The majority of respondents found it Easy (61%) to find rides on the web site and found ride descriptions Very Useful (58%); however, over a third didn’t agree.
Less than 40% of respondents found the ride rating scale Very Useful and close to a quarter hadn’t read it. These results together with anecdotal reports from ride leaders suggest that we need some improvement in this area.
Most respondents (61%) found the web site Very Useful but over almost 40% did not. Similarly, 2/3 found registering for rides Easy, but over a quarter did not.
The majority (70%) of respondents who found that a ride they wanted was full did put their names on the waitlist but about 30% did not. Could we have done a better job of letting members know that additional start times were most-often added?
Almost half of respondents (44%) joined the Club Facebook page and quite a few found it informative. However, it was shut down due to problems with administering it and liability concerns. We need to work on a replacement.
Respondents are generally very favourable to the newsletter, especially information about upcoming rides. See the pdf file for details and for information about Education topics.
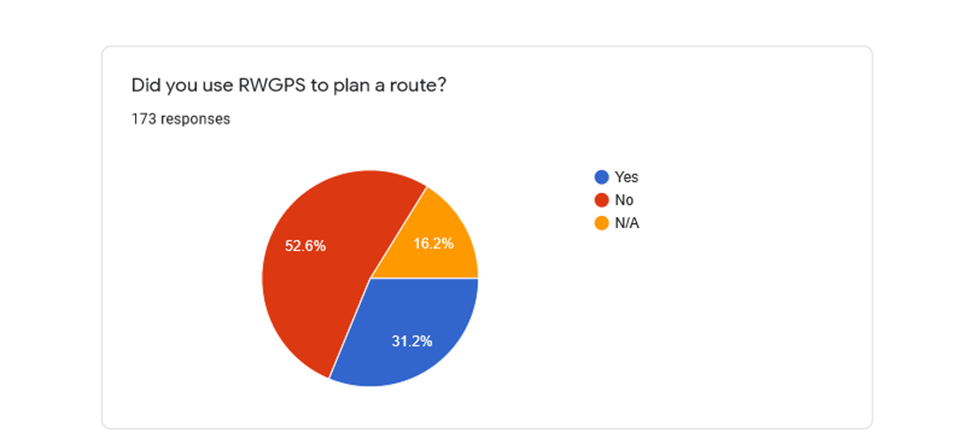
Almost ¾ of respondents (71%) installed RWGPS on their phones so over ¼ (29%) didn’t. However, remember that 30% didn’t go on any rides. 20% of those who went on no Club rides, used Club RWGPS routes on their own rides. Over 80% of those who went on at least one ride did install RWGPS, still leaving one in 5 who did not.
Most (82%) of those who went on at least one Club ride and who installed RWGPS actually used it on at least one Club ride and about half of those who installed it used it to record rides. Over half (60%) of those who installed RWGPS used it to navigate Club routes on their own. Respondent comments and anecdotal evidence indicate that some members found the routes very useful for their own rides. We may want to look into making it easier for members to find routes they want to navigate on their own. One possibility is adding RWGPS collections based on ride characteristics (limited to one dimension) and/or using RWGPS tags (which could have e.g., type of ride, distance and location tags).
Over 1/3 (36%) of those who installed RWGPS used it to plan routes.
As we indicated in a Newsletter item, RWGPS was a major success story last year.